Home > Football Recruiting > Tennessee > Nashville, TN > Donelson Christian Academy > Nathaniel Stewart
GET RECRUITED TO PLAY YOUR SPORT IN COLLEGE
NCSA IS THE WORLD'S LARGEST COLLEGE RECRUITING NETWORK
330,000+
Total NCSA Athlete College Commitments
Top NCSA Athletes at Donelson Christian Academy


Top NCSA Athletes in Area


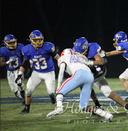
Nathaniel Stewart '15 Recruiting Profile

Height5'10"
Weight175lbs
Age28
Primary PositionRunning Back
Secondary PositionAthlete
Dominant HandRight
Video
 2014 Highlights
 2013 Highlights
 2012 Highlights
Personal Statement
Nathaniel has not added a personal statement yet.
Athletics
High School Information
- Years w/ Varsity
- 4 years
- Varsity Starter
- 4 years
- 2014 Varsity Team
- Starter- Jersey: #21
Individual Awards
- 1st Team All-Conference, Captain
- 2013 Varsity Team
- Starter- Jersey: #21
Individual Awards
- 1st Team All-Conference
Team Awards
- State 3rd Place, Regional Champs
- 2012 Varsity Team
- Starter- Jersey: #21
Individual Awards
- Lettered
Team Awards
- State 3rd Place, Regional Champs
- 2011 Varsity Team
- Starter- Jersey: #21
Individual Awards
- Lettered
Team Awards
- Regional Champs
Coach References
- High School Head Coach
- Dennis Goodwin
- Position Coach
- Paul Downing
- Private Coach
- James Wilhoit
- Private Coach
- Coach Lamont Ramsey
Events
- Camp/Event
- Nike Football Training Camp
- 6/01/14 to 6/01/14
- Camp/Event
- Nike Football Training Camp
- 3/30/14 to 3/30/14
- Camp/Event
- Nike Sparq Combine
- 3/22/14 to 3/22/14
- Camp/Event
- Princeton Football Camp
- 6/28/13 to 6/28/13
- Camp/Event
- Northwestern "Chicago Showcase"
- 6/14/13 to 6/14/13
- Camp/Event
- Indiana University Football Camp
- 6/12/13 to 6/12/13
- Camp/Event
- Washington University Prospect Camp
- 6/10/13 to 6/10/13
- Camp/Event
- Austin Peay Football Camp
- 6/01/13 to 6/01/13
- Camp/Event
- NUC Combine
- 4/21/13 to 4/21/13
- Invite to Ultimate 100 Camp 2013
- Camp/Event
- Webletes Combine
- 3/15/13 to 3/15/13
- Camp/Event
- Vanderbilt Football Camp
- 7/15/12 to 7/15/12
- Camp/Event
- Clemson "Dabo Swinney" Football Camp
- 6/15/12 to 6/17/12
Training
- Weight Training
- 4 years
- S.A.C.S Speed & Agility Training
- 2 years
- Coach Lamont Ramsey
- Wilhoit Kicking
- 2 years
- Training for Kicking/Punting
Additional Sports
- Soccer
- 3 years
- Varsity Team
- Track
- 4 years
- Varsity Team
- Team Captain
Statistics
| Statistic | 2014 Varsity Team | 2013 Varsity Team | 2012 Varsity Team | 2011 Varsity Team |
|---|---|---|---|---|
| Games played | 10 | 13 | 12 | |
| Rushing attempts | 134 | 141 | 24 | |
| Rushing yards | 894 | 1045 | 731 | 193 |
| Receiving yards | 144 | 86 | ||
| Receptions | 8 | 5 | ||
| Rushing touchdowns | 11 | 11 | 3 | 2 |
| Touchdown receptions | 1 | 1 | ||
| Yards per reception | 18 | 17 | ||
| Yards per rush | 6.67 | 7.27 | 5.3 | |
| Assisted tackles | 4 | 2 | 8 | 1 |
| Pass break-ups | 3 | 7 | ||
| Solo tackles | 13 | 14 | 16 | 3 |
| Interceptions | 1 | 1 | 1 | |
| Average kickoff distance | 48.2 | 45.36 | ||
| Extra points/attempts | 40/41 | 54/60 | ||
| Field goals/attempts | 3/4 | 9/10 | ||
| Long field goal | 35 | 36 | ||
| Touchback percentage | 21 | |||
| Average yards per punt | 35.84 | 34.40 | 28.5 | |
| Long punt | 51 | 45 | 49 | |
| Punting attempts | 19 | 15 | 46 | |
| Punts inside the 20 | 4 | |||
| Yrd/kick off return | 157/5 | |||
| Longest return | 52 | 36 | ||
| Longest punt return | 21 | 20 | ||
| Total punt return yrds | 29 | |||
| Total kick off return yrds | 220 |
Academics
Grades
This information is unavailable to unknown [or unregistered] users
Test Scores
This information is unavailable to unknown [or unregistered] users
Academic Accomplishments
Are you in honor classes?
Yes. Honor English I & II, Honor Algebra I & II, Honor Geometry, Honor Biology & Chemistry Honor PreCalculus, Honor Physics, DE Honors English III DE Honors 3D DesignAre you in AP/IB classes?
Yes. Ap Chemistry, AP Physics, AP CalulusRegistered with the NCAA Eligibility Center?
YesAwards and Activities
- AwardsNational Honor Society, Distinguishing Scholar, Latin Summa Cum Laude, Principles List
- ActivitiesMu Alpha Theta, Student Council, Quiz Busters, FCA , Chem Club, Food Harvest Bank, Toys for Tots