GET RECRUITED TO PLAY YOUR SPORT IN COLLEGE
NCSA IS THE WORLD'S LARGEST COLLEGE RECRUITING NETWORK
330,000+
Total NCSA Athlete College Commitments
Top NCSA Athletes at Elmwood High School


Top NCSA Athletes in Area


Jill Hannah '19 Recruiting Profile
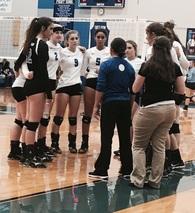
ClubBlack Swamp - Tiffin, OH - 3 years
Height5'8"
Weight130lbs
Age24
Primary PositionLibero
Secondary PositionOutside Hitter
Dominant HandRight
Standing Reach7 ft
Video
 Jill Hannah - Jun...
Personal Statement
Athletics
High School Information
- Years w/ Varsity
- 4 years
- Varsity Starter
- 4 years
- 2018 Varsity Team
- Starter- Jersey: #12
Individual Awards
- 1000 DIGS !!
- 2017 Varsity Team
- Starter- Jersey: #12
Individual Awards
- 2nd Team All-Conference, 2nd Team All-County, 2nd Team All-Area, Captain, Defensive Player of the Year (team voted)
- 2016 Varsity Team
- Starter- Jersey: #14
Individual Awards
- Honorable Mention All-Conference
- 2015 Varsity Team
- Starter- Jersey: #14
Individual Awards
- Most Improved
Team Awards
- Conference 3rd Place, Sectional 2nd Place
Club Information
- Seasons of Club Experience
- 1 season
- 2013 Black Swamp - Tiffin, OH - 3 years
- 3 years
Coach References
- High School Head Coach
- Penny Rayle
Training
- Strength & Conditioning
- 2 years
- Weight lifting and Conditioning with a Strength and Conditioning Coach
Additional Sports
- Basketball
- 3 years
- Varsity Team
- Most Improved (on team) 2015-2016 Season, Honorable Mention in District 2015-2016 Season, Assist Leader (on team) 2016-2017 Season, Lettered as Freshman
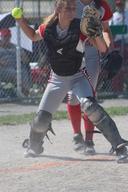
- Softball
- 3 years
- Varsity Team
- Lettered as Freshman (2016 Season), 2nd Team All-League ( 2016 Season), 2nd Team All-District (2016 Season), 2018 Season: 2nd Team League; 1st Team All-District
Statistics
| Statistic | 2017 Varsity Team | 2016 Varsity Team | 2015 Varsity Team |
|---|---|---|---|
| Attack Kills | 21 | 107 | 13 |
| Attack Errors | 8 | 57 | 18 |
| Total Attempts | 157 | 415 | 71 |
| Kill Percentage | 13.4% | 12% | |
| Kills/Game | 1.1 | 4.86 | .6 |
| Assist Percentage | 16.5% | 23.5% | 18.4% |
| Assists/Game | 1 | .87 | .8 |
| Digs | 394 | 190 | 144 |
| Digs/Game | 20.7 | 8.64 | 6.5 |
| Receiving Chances | 418 | 211 | 238 |
| Receiving Errors | 24 | 21 | 20 |
| Receiving Percentage | 94.3% | 90% | 92% |
| Aces | 20 | 54 | 35 |
| Aces/Game | 1 | 2.45 | 1.5 |
| Service Errors | 6 | 22 | 19 |
| Serving Percentage | 97% | 94% | 93% |
| Games Played | 19 | 22 | 22 |
| Matches Played | 66 | 74 | 73 |
Academics
Grades
This information is unavailable to unknown [or unregistered] users
Test Scores
This information is unavailable to unknown [or unregistered] users
Academic Accomplishments
Are you in honor classes?
Yes. Advanced English 11 Pre-CalculusAwards and Activities
- AwardsNational Honor Society, Honor Roll
- ActivitiesSpanish Club Younglife Bible Study